Real-Time Financial News Sentiment Dashboard
Providing live financial news sentiment analysis to empower investors and analysts with instant market insights.
Python · Streamlit · FinBERT · Plotly · NLP
Project Overview
I developed this dashboard to address the challenge of information overload in financial markets. My goal was to provide an intuitive and accessible tool for anyone—from seasoned investors and analysts to curious individuals—to instantly gauge the sentiment surrounding any stock or company in real-time. By leveraging cutting-edge natural language processing (specifically FinBERT) and a user-friendly web application, users can quickly understand market mood with minimal effort.
Significance & Impact
Financial news can rapidly influence market movements, and overlooking a shift in sentiment can lead to missed opportunities. This dashboard eliminates the need for expensive proprietary tools or tedious manual review of countless headlines. It empowers users to quickly identify sentiment trends, react promptly to market changes, and make more informed decisions, all through a clean, straightforward interface.
Key Features
- News Aggregation: Integrated with NewsAPI to fetch the latest financial headlines based on user-defined keywords and date ranges.
- Automated Sentiment Analysis: Employed FinBERT, a domain-specific BERT model, to automatically classify news articles as positive, negative, or neutral.
- Interactive Visualizations: Created dynamic and clear charts (including pie charts and line graphs) using Plotly to visually represent sentiment trends at a glance.
- Intuitive User Interface: Designed a clean and user-friendly web application with Streamlit, enabling seamless search, filtering, and instant display of sentiment results.
- Automated Workflow: Streamlined the entire process—from news updates and sentiment analysis to data presentation and error handling—ensuring a robust and "just works" experience for the user.
Technical Approach
- The entire application was developed in Python, prioritizing flexibility, modularity, and transparency.
- Real-time financial news is sourced via the NewsAPI, while sentiment scoring is powered by the FinBERT model.
- The interactive visualizations and the web application itself were constructed using Streamlit and Plotly.
- The codebase is designed to be simple, modular, and easily deployable or extensible by other developers.
Learnings & Reflections
This project significantly advanced my skills in Natural Language Processing (NLP), sophisticated data visualization, and the practical development of user-facing web applications. The most gratifying aspect is seeing how it translates complex technical capabilities into a simple, highly useful tool for anyone seeking a competitive edge in finance.
Visual Highlights
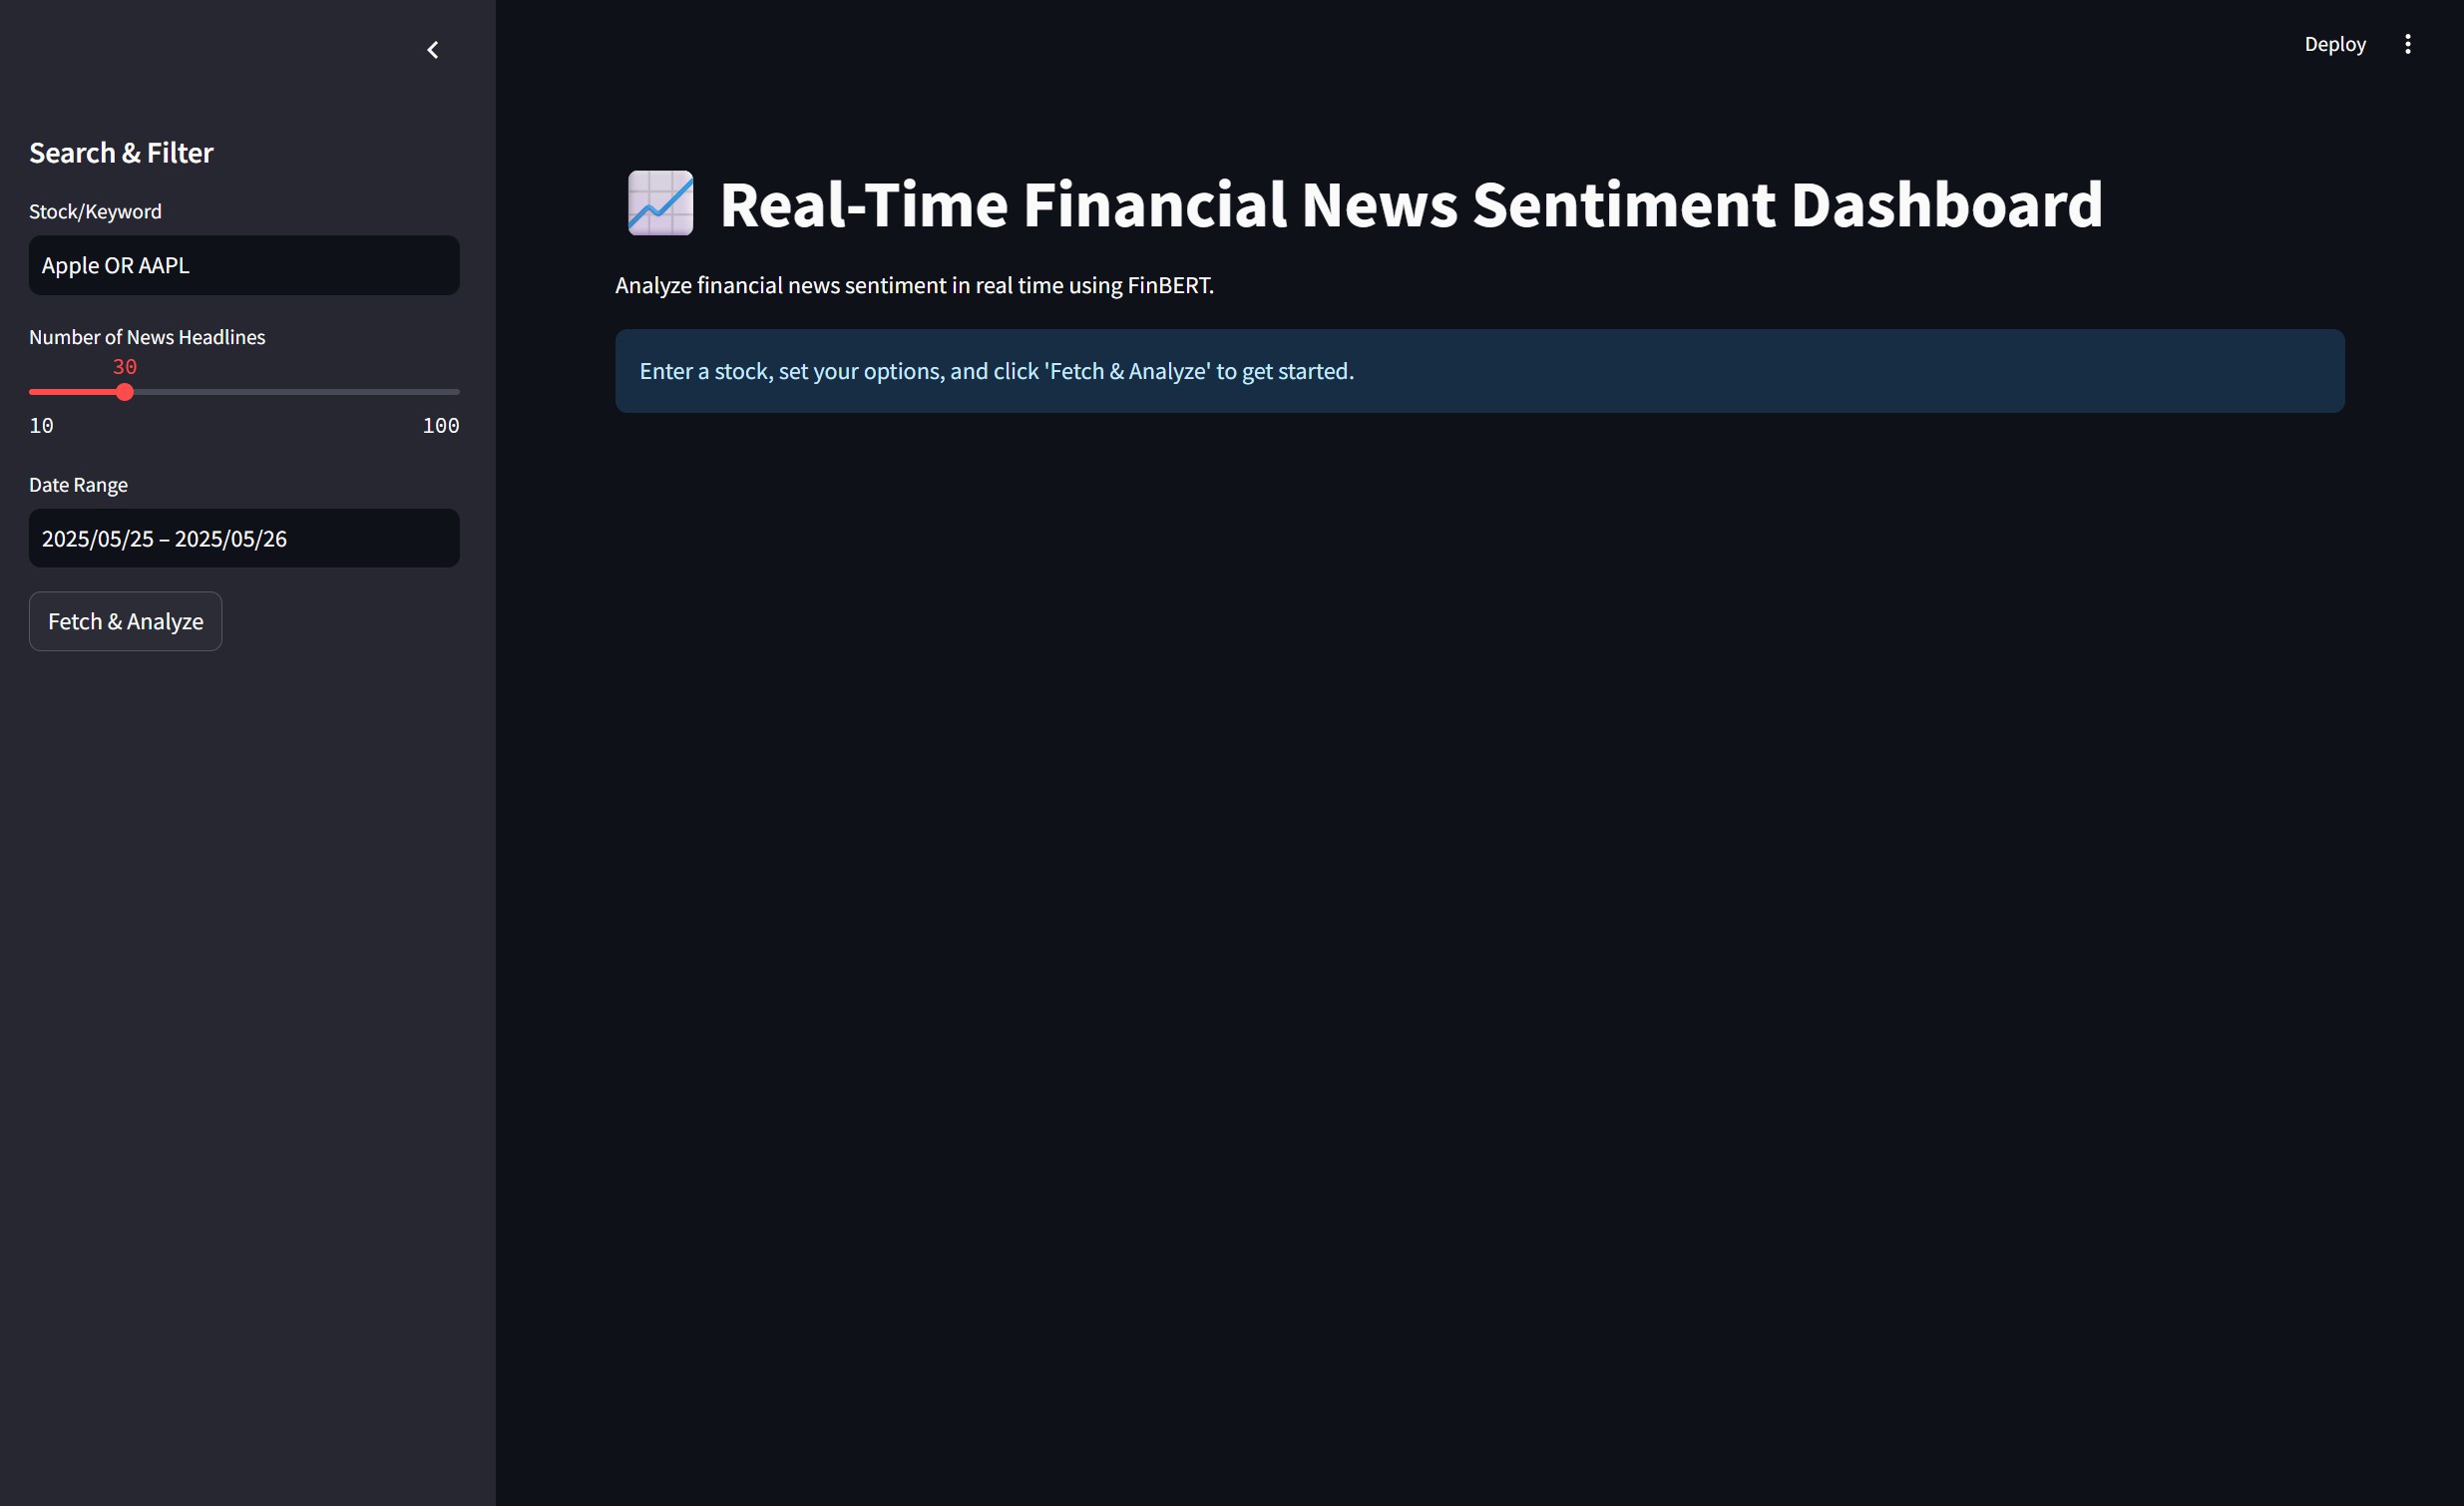
The main user interface of the Real-Time Financial News Sentiment Dashboard.
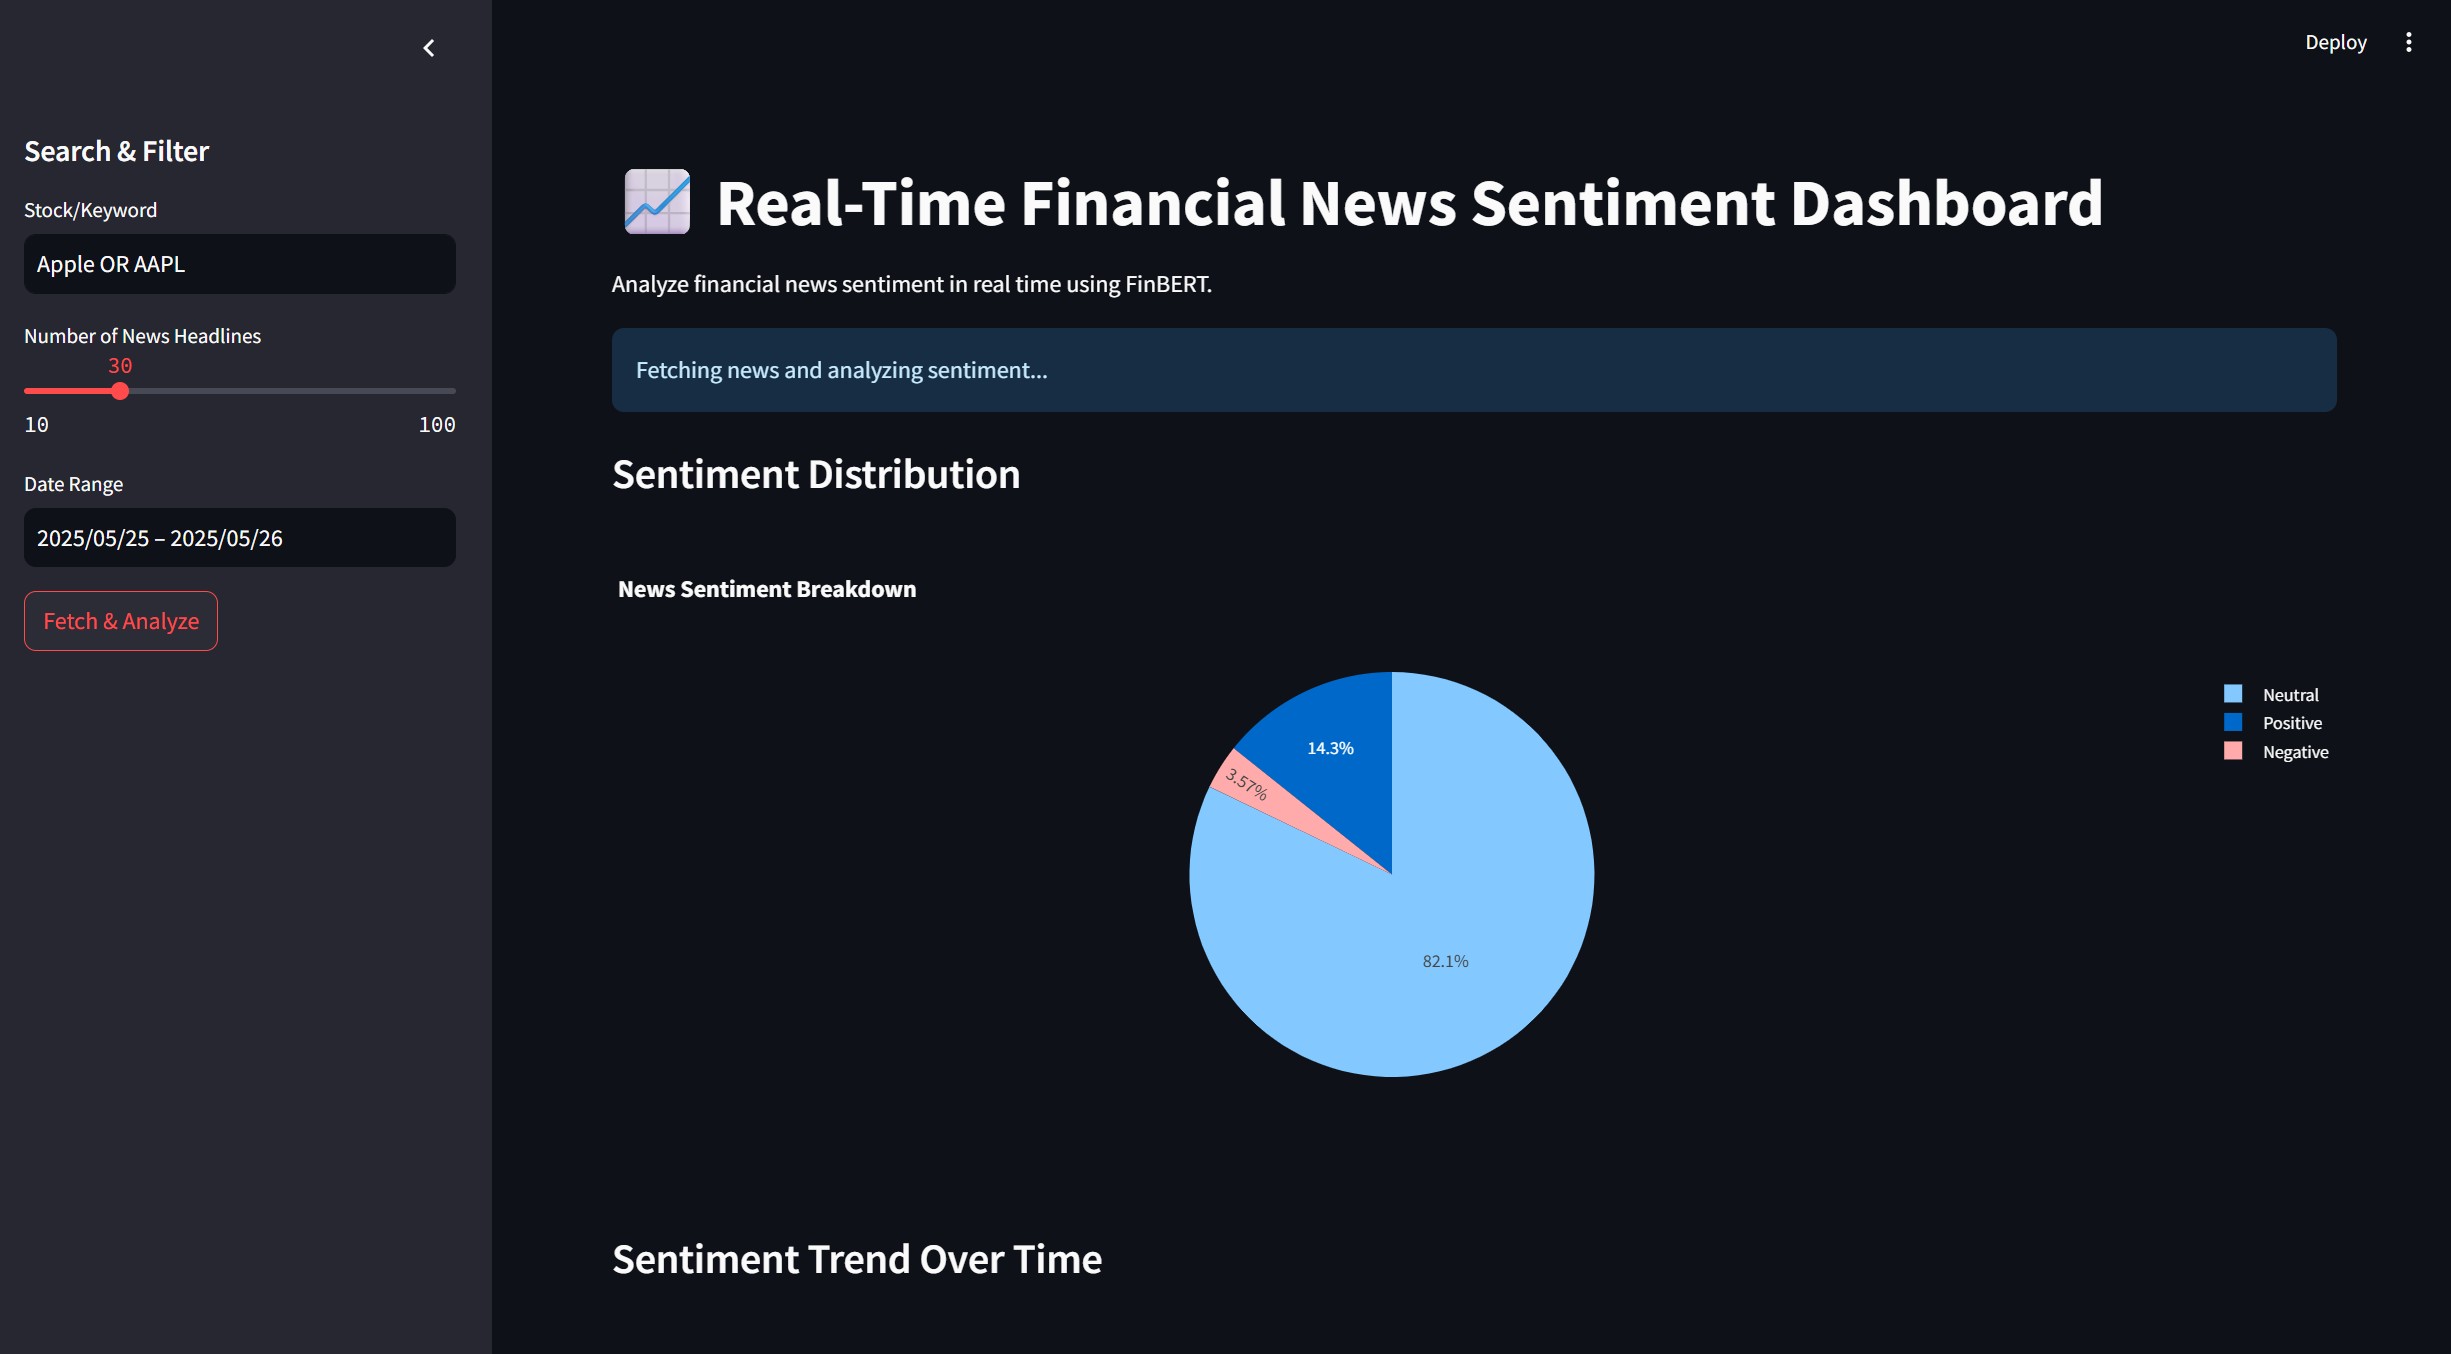
Sentiment analysis results for Apple stock, showcasing positive, negative, and neutral distribution.
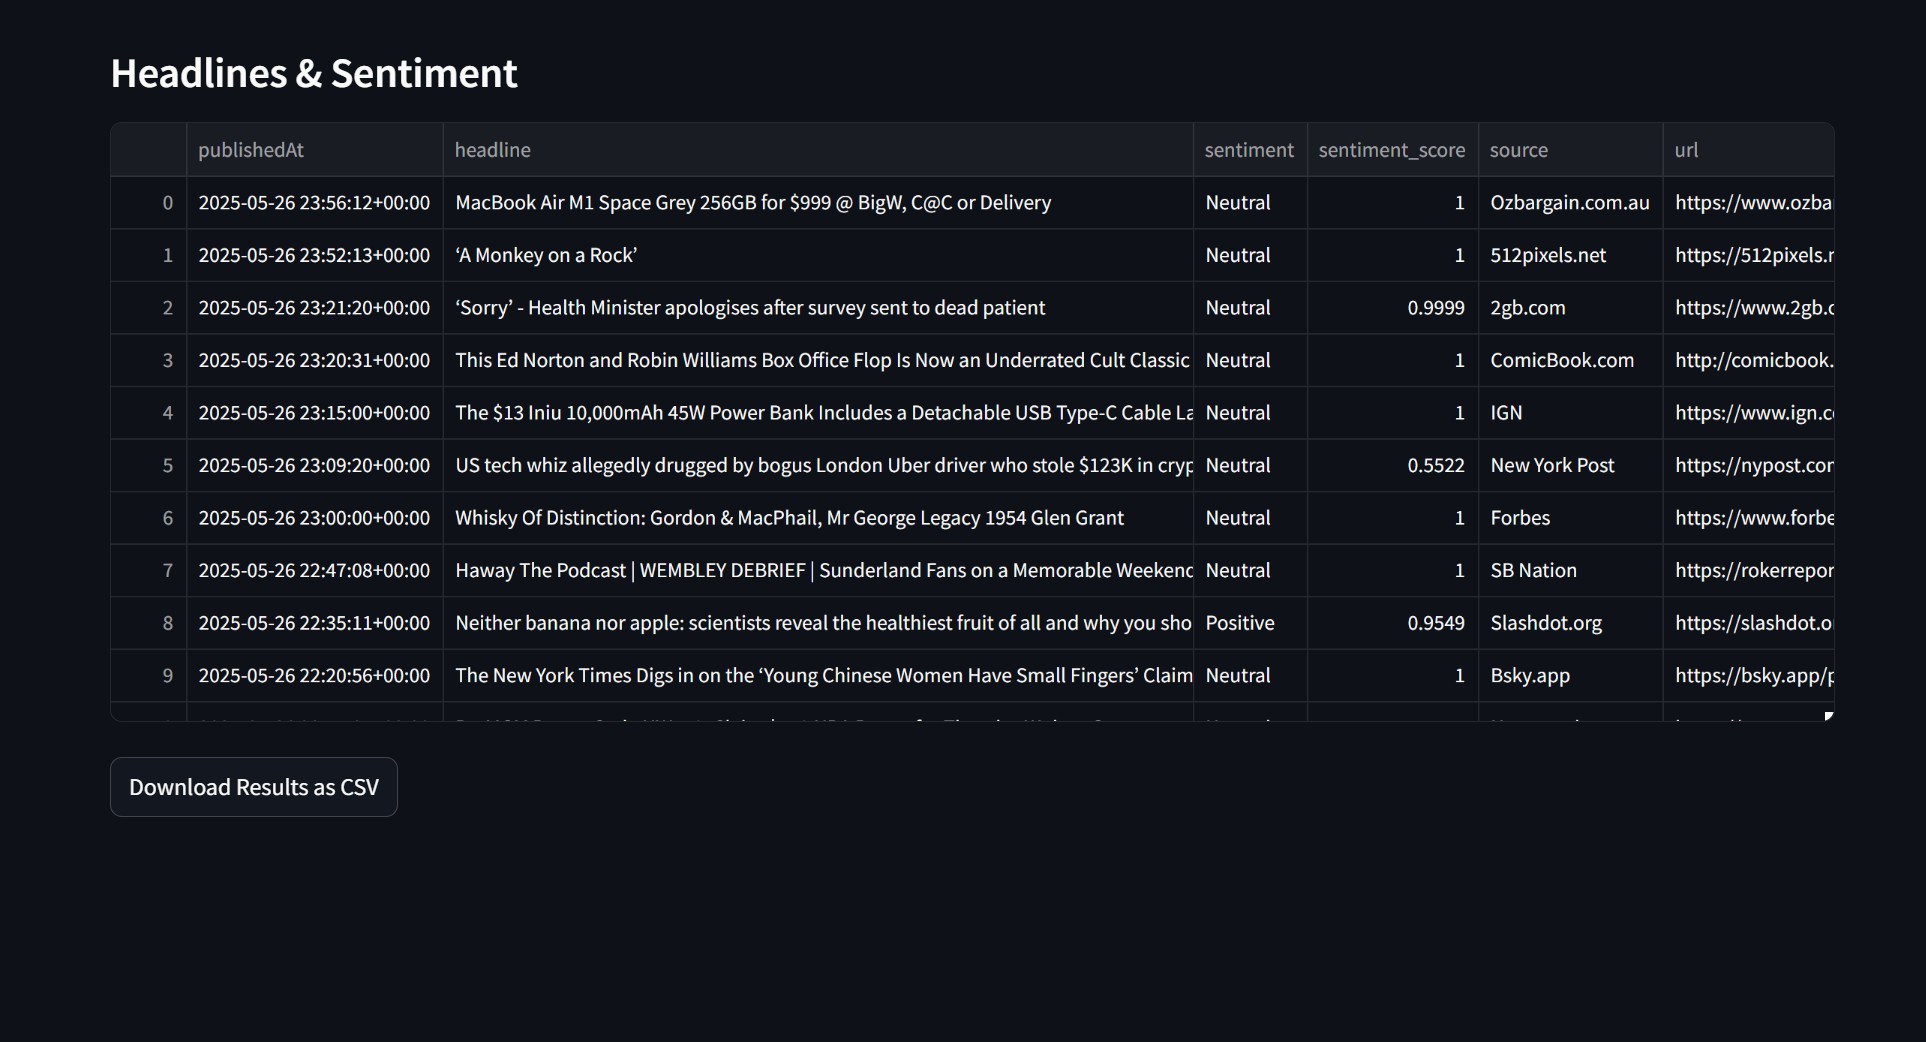
A view of the latest 30 news articles retrieved for Apple, with their corresponding sentiment scores.
Full Tech Stack Used
- Languages: Python 3
- NLP Models: Transformers (FinBERT)
- Data Manipulation: Pandas
- Web Application Framework: Streamlit
- Visualization: Plotly
- APIs: NewsAPI