
Resilient Energy Consumption Forecasting
Developing energy forecasts that are not just accurate, but also reliable and robust—even amidst real-world data imperfections and system disruptions.
Python · Streamlit · Prophet · Data Science · Reliability Engineering
Project Overview
I developed this application from a firsthand understanding of how critical it is for energy systems—be it power grids, manufacturing facilities, or data centers—to have predictive models they can truly trust. My primary objective was to engineer a solution that is not only intelligent but also resilient enough to perform flawlessly even when faced with imperfect real-world data. I leveraged Python, Prophet, and Streamlit, embedding custom reliability features throughout the development process.
Significance & Impact
Accurate energy forecasts are foundational to maintaining stable power supplies and enabling efficient planning for individuals and industries. However, conventional models often falter when encountering anomalous data or information gaps. My aim was to overcome this by creating a tool that consistently delivers actionable predictions, even if unforeseen issues arise. This project resonates deeply with me because I am driven to create solutions that yield tangible, real-world impact beyond theoretical laboratory settings.
- Prevents blackouts and overloads: By delivering reliable forecasts, operators gain early visibility into potential issues, enabling proactive planning and load balancing.
- Keeps businesses running smoothly: Industries like manufacturing, healthcare (hospitals), and data centers can make more confident and safer operational decisions.
- Helps the planet: Enhanced forecast reliability facilitates the safer and more efficient integration of intermittent renewable energy sources into the grid.
- Supports operational safety: The tool is designed to provide sensible predictions even in emergency scenarios, ensuring continuous decision support.
- Builds trust: By transparently illustrating the provenance of each prediction (whether from the primary model or a fallback), users can unequivocally rely on the results.
- Saves money and cuts waste: Superior forecasting translates directly into reduced energy wastage and optimized operational costs.
In summary: My commitment was to construct a forecasting system that is inherently trustworthy and intuitive, empowering users to make critical decisions with confidence when it matters most.
Key Features
- Full-Stack Development: I managed the end-to-end development, from data cleaning and feature engineering to model training and the creation of an intuitive, interactive Streamlit dashboard.
- Inherent Resilience: Integrated a custom-designed "circuit breaker" mechanism that intelligently detects anomalous or failing forecasts and seamlessly switches to a pre-defined, safe fallback prediction (e.g., 7-day moving average), preventing unreliable outputs.
- User-Centric Design: The Streamlit interface allows users to easily adjust forecasting parameters, visualize clear historical data vs. predictions, and instantly discern whether a given forecast is from the primary model or the fallback system.
- Robust Testing: Implemented a comprehensive suite of unit and integration tests, specifically focusing on error handling and graceful degradation scenarios to ensure real-world operational robustness.
- Modern Tooling & Impact: Leveraged leading open-source Python libraries to deliver a high-impact solution that prioritizes operational stability and user confidence.
Technical Workflow
- Data Ingestion: The application ingests energy consumption data (from real-world sources or simulated, often with introduced anomalies for robustness testing).
- Predictive Modeling: Utilizes advanced time-series models such as Prophet or ARIMA to generate future energy consumption forecasts.
- Anomaly Detection & Fallback: Implements a built-in "circuit breaker" that continuously monitors forecast outputs. If a prediction deviates significantly from expected patterns or the model fails, it automatically triggers a switch to a pre-configured, reliable fallback mechanism (e.g., historical averages).
- Interactive Visualization: All processes—from raw data to primary forecasts and fallback predictions—are displayed live on an interactive Streamlit dashboard, providing transparent insights into the system's behavior.
Visual Highlights
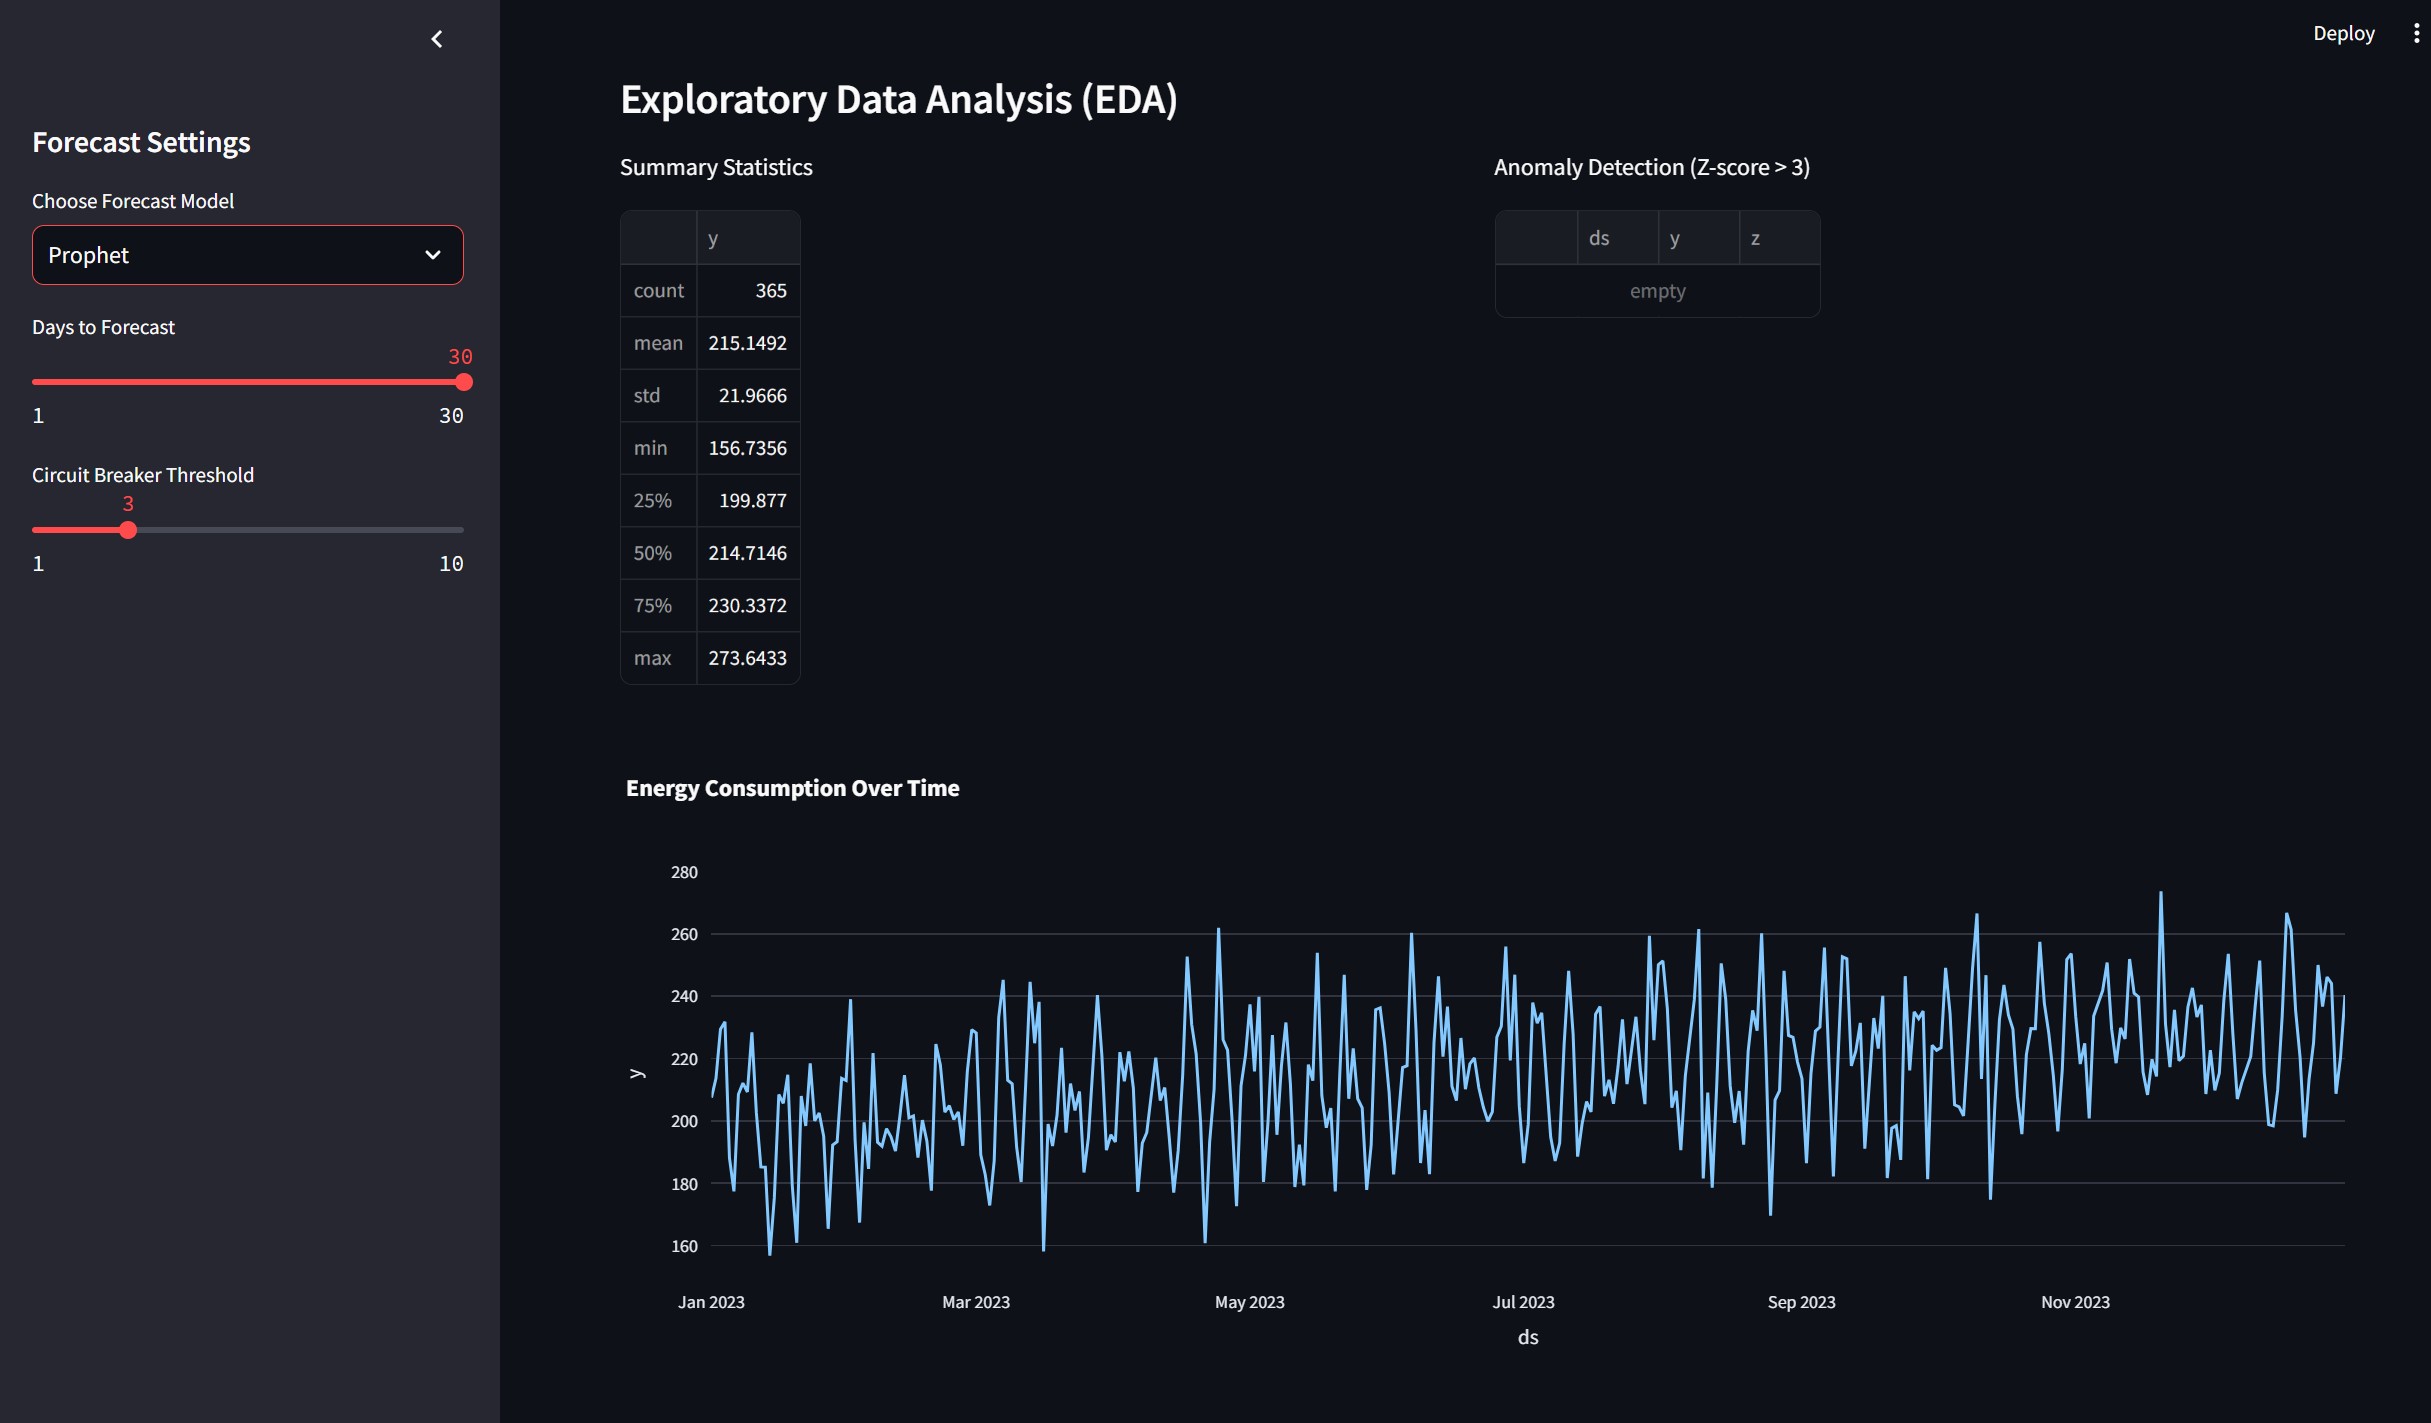
Visualization of historical energy consumption data, demonstrating trends and patterns.
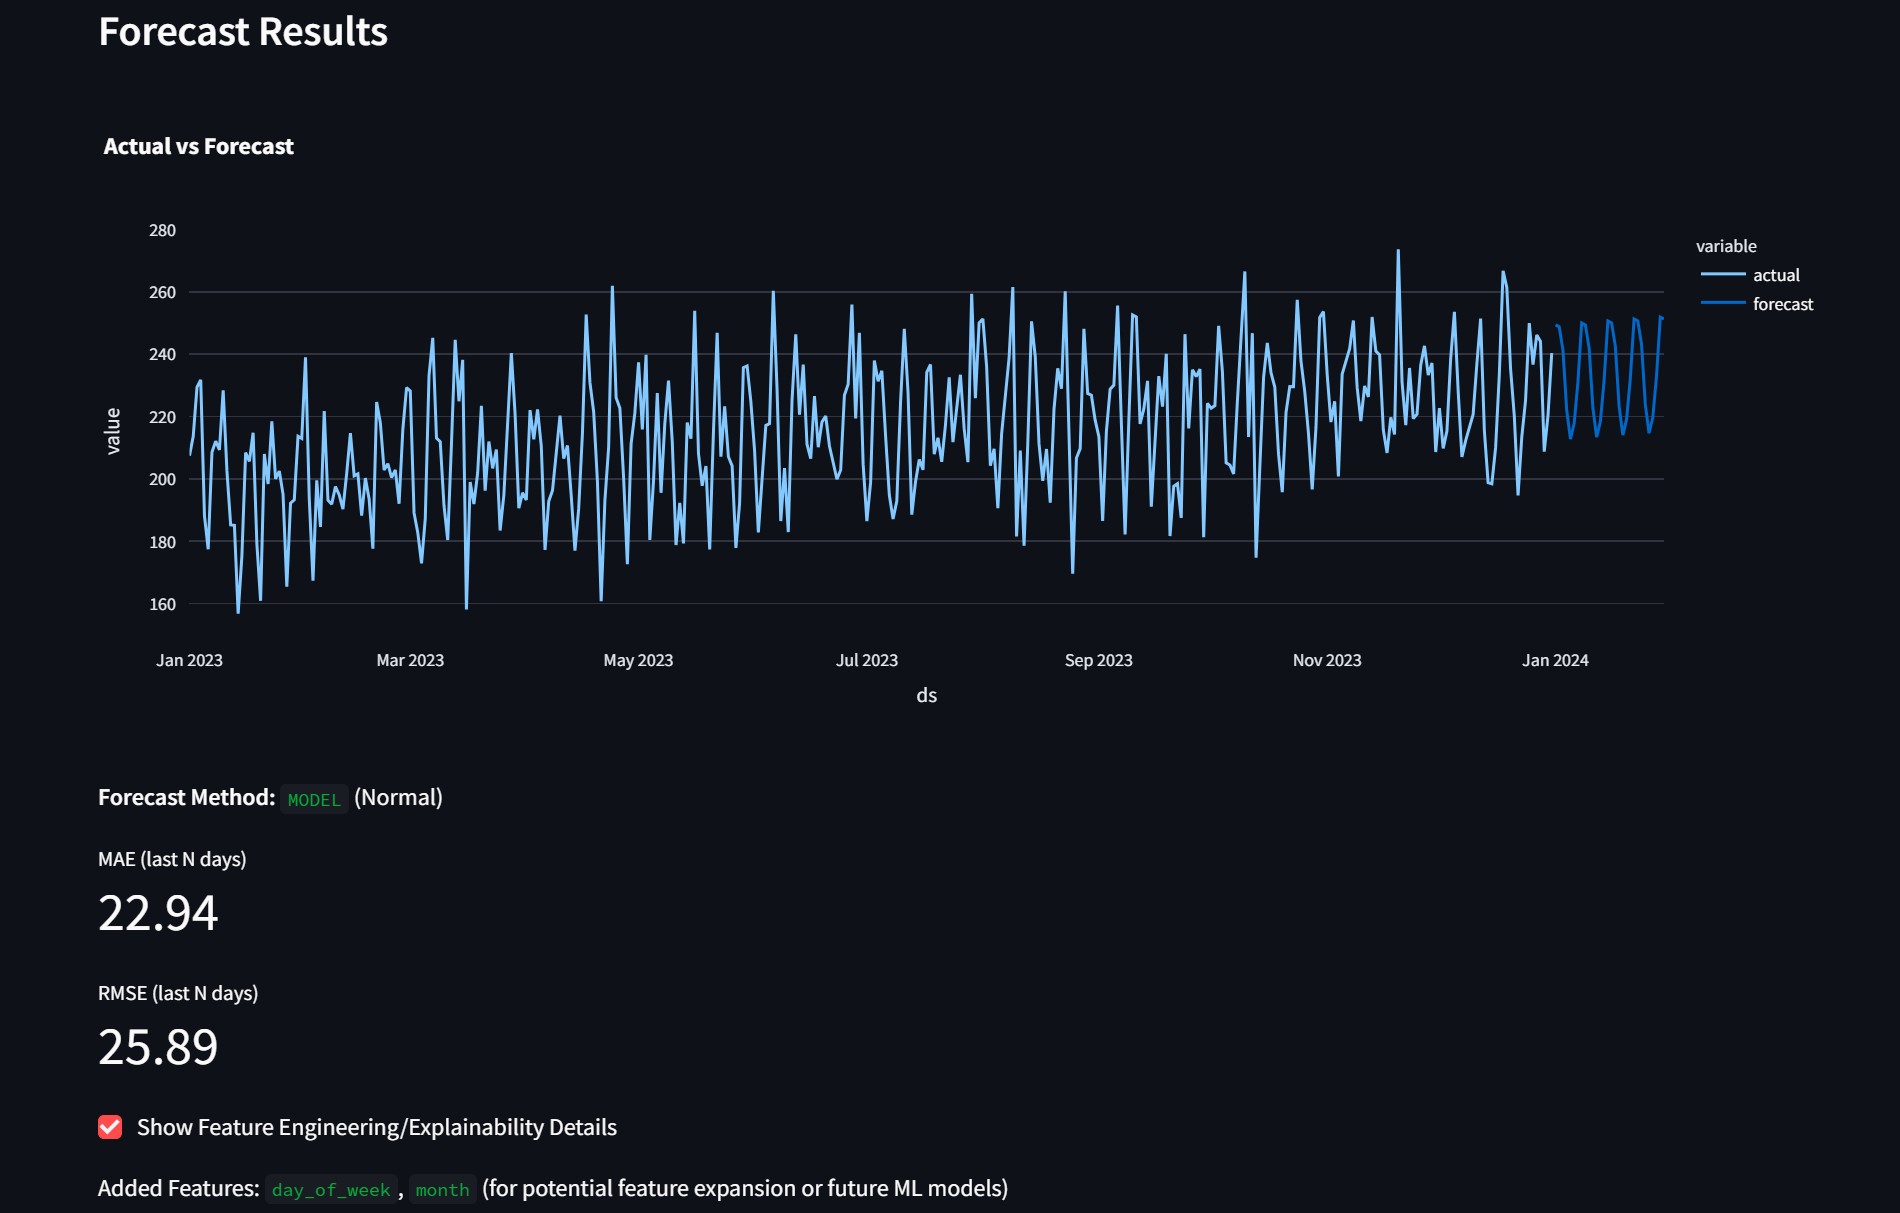
An example of the Streamlit dashboard displaying forecasted energy consumption against actuals, including confidence intervals.
Learnings & Reflections
This project was a profound learning experience, shifting my focus from purely theoretical model accuracy to practical system resilience and user trust. It taught me the invaluable lesson of designing for failure and building robust systems that function reliably in unpredictable real-world environments. I am particularly proud of creating a tool that can genuinely contribute to operational stability and empower better decision-making in critical infrastructure. I am eager to continue developing solutions that offer substantial real-world utility.
Full Tech Stack Used
- Languages: Python 3
- Libraries: Prophet, ARIMA, Pandas, NumPy, Streamlit, Matplotlib, Seaborn
- Tools: Jupyter Notebook, Streamlit
- Concepts: Time Series Forecasting, Anomaly Detection, Reliability Engineering, Data Visualization, Web Application Development