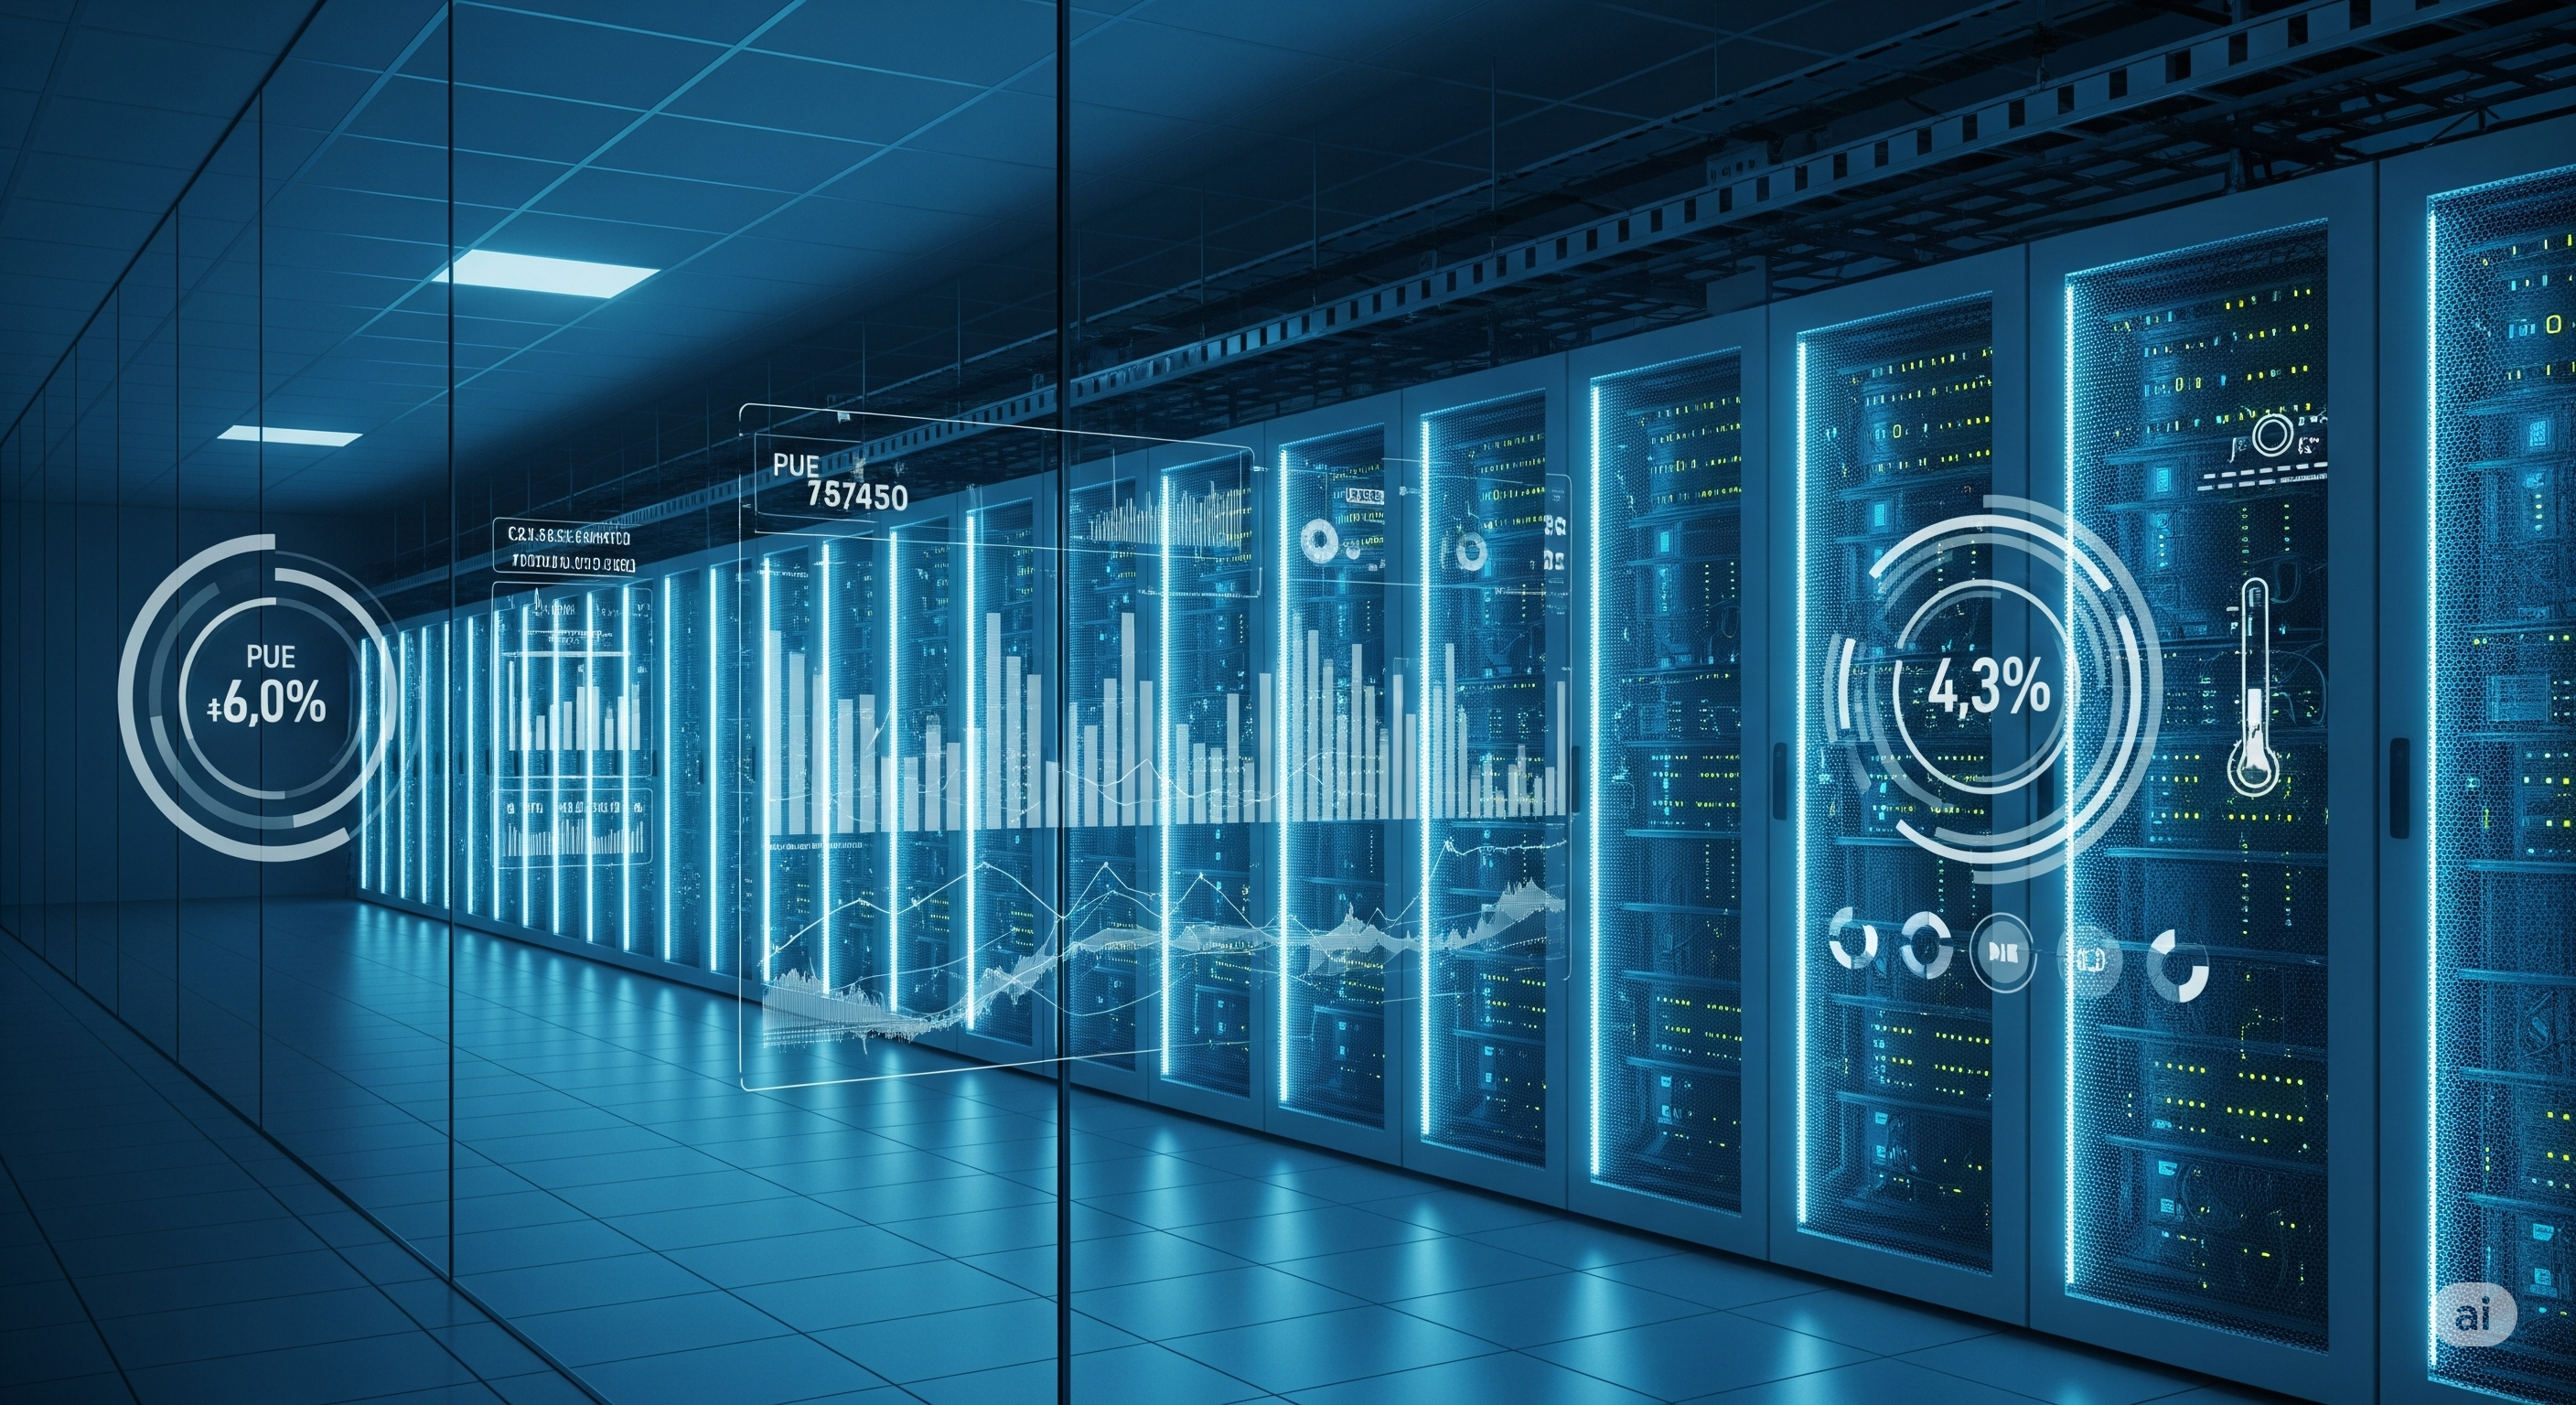
Main dashboard displaying key data center metrics like PUE, power consumption, and temperature.
Real-Time Data Center Health & Efficiency Monitor
A complete real-time monitoring, anomaly detection, and performance optimization system for large-scale data centers.
Python · PySpark · Kafka · SQLite · Flask · Docker · SQL · Pandas · NumPy
Project Overview
This project delivers a cohesive real-time solution for monitoring the health and energy efficiency of data centers. It ingests continuous IoT sensor data, computes metrics such as Power Usage Effectiveness (PUE), detects anomalies, and visualizes live operational insights through a responsive web dashboard. The system empowers operators to identify and address issues rapidly, enhancing uptime, performance, and sustainability.
Key Features
- Real-Time Data Ingestion: Collects continuous streams of simulated sensor data, including power, temperature, and CPU usage.
- Live Data Processing: Processes data on-the-fly to calculate KPIs and detect operational anomalies.
- PUE Computation: Automatically evaluates Power Usage Effectiveness to track real-time energy performance.
- Anomaly Detection: Identifies irregular readings signaling conditions like overheating or unexpected load spikes.
- Historical Data Retention: Stores processed metrics for long-term trend analysis and optimization studies.
- Interactive Dashboard: Enables dynamic visualization of live metrics and system status for efficient monitoring.
Workflow Overview
- A Python script simulates IoT sensors generating live readings (power, CPU load, temperature) across critical infrastructure.
- Sensor streams are transmitted via Kafka, which serves as the data ingestion pipeline.
- PySpark Structured Streaming consumes messages continuously, performs JSON parsing, enrichment, and real-time computation of derived features (e.g., PUE, room-level metrics).
- Aggregated and validated data is persisted into an SQLite database using a star-schema design for performance efficiency.
- A Flask web app dynamically queries and renders this data to provide a live operational dashboard.
System Architecture
- Data Simulation: Python with NumPy and Kafka APIs to stream synthetic IoT data.
- Messaging Layer: Kafka + Zookeeper managed by Docker Compose for durability and scalability.
- Stream Processing: PySpark Structured Streaming handling computation, aggregation, and anomaly logic.
- Storage: SQLite database organized into dimension and fact tables for structured data analysis.
- Backend & API Layer: Flask backend for querying processed data and serving dashboard APIs.
- Visualization: Flask-embedded dashboard for interactive analytics visualization.
- Containerization: Full setup controlled using Docker and orchestrated via Python subprocess automation.
Visual Highlights
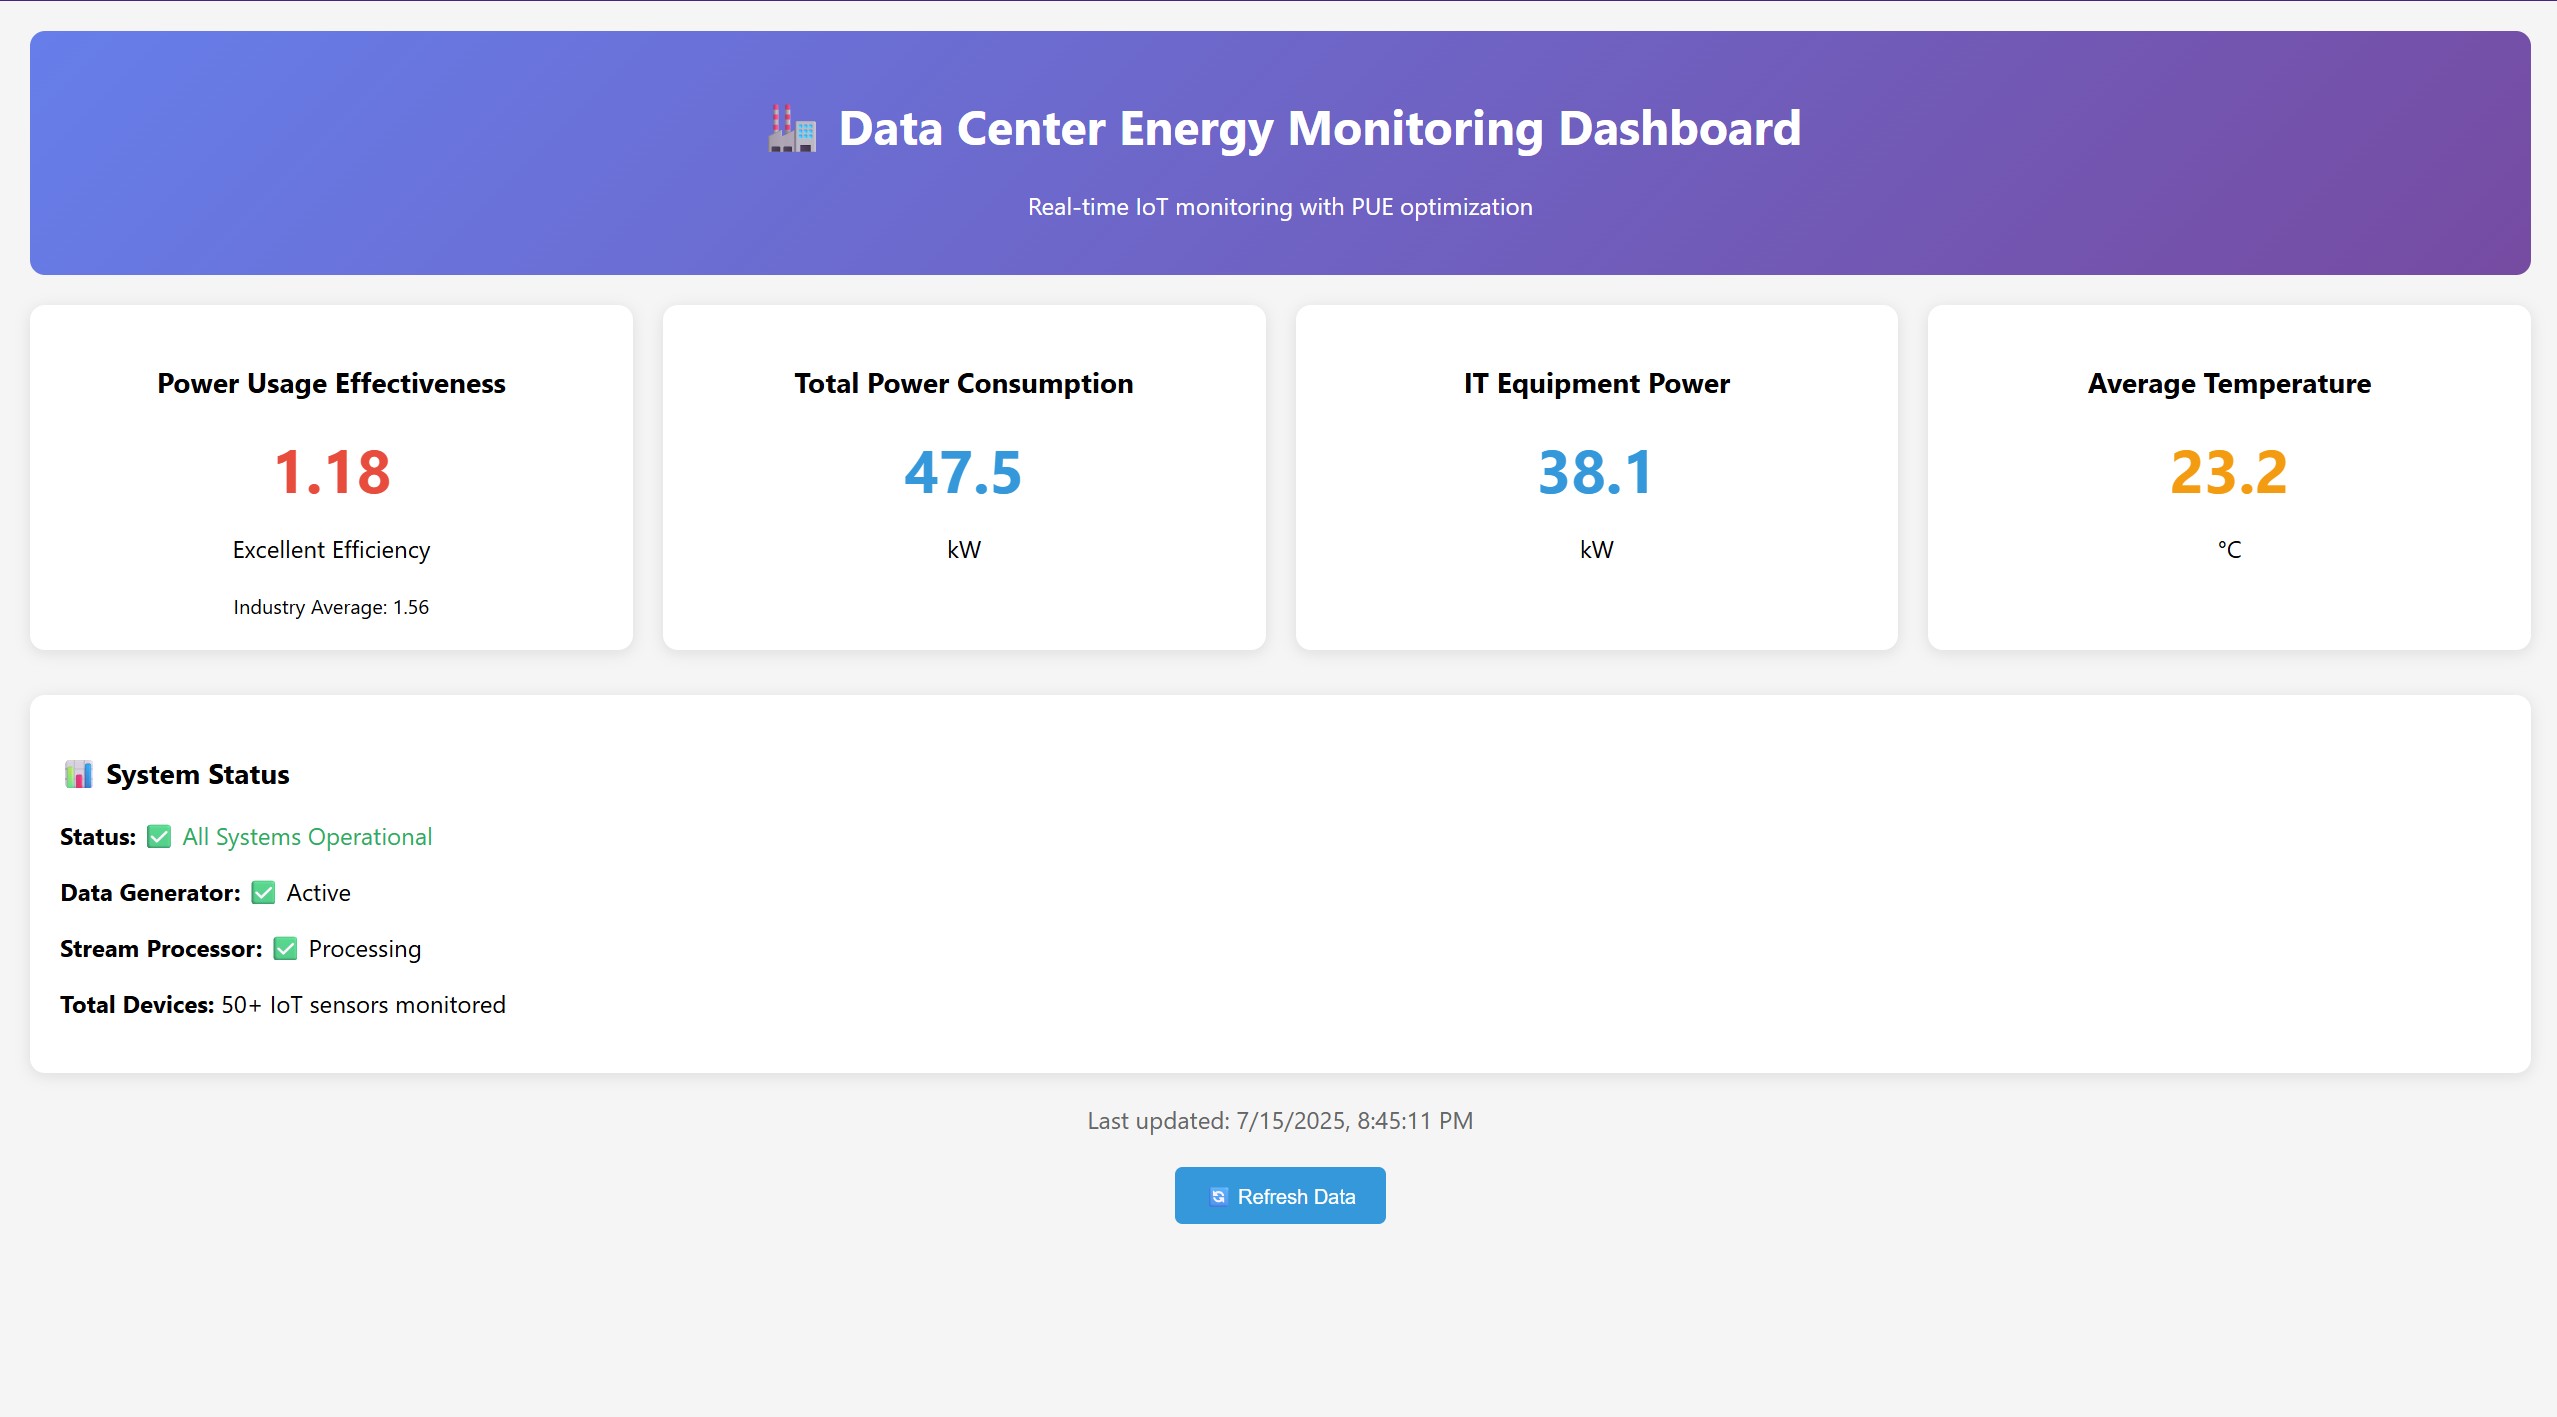
Dashboard displaying PUE, power breakdowns, temperature trends, and alert notifications in real-time.
Full Tech Stack
- Languages: Python
- Streaming Framework: PySpark
- Messaging: Kafka, Zookeeper
- Database: SQLite
- Web Framework: Flask
- Orchestration & Deployment: Docker, Docker Compose
- Libraries: Pandas, NumPy
Key Learnings & Impact
This project offered in-depth exposure to end-to-end streaming architecture — from data generation to dashboard deployment. It strengthened proficiency in PySpark Structured Streaming, hands-on Kafka deployment, and efficient time-series data modeling. The work highlights expertise in real-time analytics, anomaly detection, and system observability — critical for scalable, production-grade monitoring infrastructures.