Predicting Crop Yields in a Changing Climate
Using data science and machine learning to understand and forecast the impact of climate change on global food production.
Python · Prophet · Time Series · Data Visualization
Project Overview
Climate change isn’t just news—it’s something that’s already changing the way we grow our food. I wanted to see, with real data, how rising temperatures might change crop yields around the world. So, I used open datasets and built forecasts with Prophet (a time series tool) to predict what could happen to crops in the next few years. My goal? Turn all that data into something useful that farmers and decision-makers can actually use.
Significance & Impact
Food security needs clear vision. Even a little change in weather can mean a lot for food and for people’s lives. I wanted my project to give helpful, honest forecasts—so farmers can plan ahead, and leaders can prepare for what’s coming.
- Help farmers and businesses get ready for a changing climate.
- Give useful info to people making policies or running food programs.
- Strengthen food supply chains against climate surprises.
Methodology & Approach
- Gathered the data: I pulled together crop yield and climate data from various sources, performed rigorous cleaning, and handled missing values using imputation techniques.
- Engineered new features: Created new climate indicators, such as cumulative growing degree days and extreme temperature event flags, to enhance the predictive power of my models.
- Built the models: Employed Facebook Prophet for time-series forecasting, leveraging its ability to model trends, seasonality, and holidays, and integrated temperature data as an exogenous regressor.
- Visualized the results: Developed clear and interactive charts using Matplotlib and Plotly, displaying five-year forecasts with confidence intervals to convey potential risks and uncertainties to stakeholders.
Visual Highlights
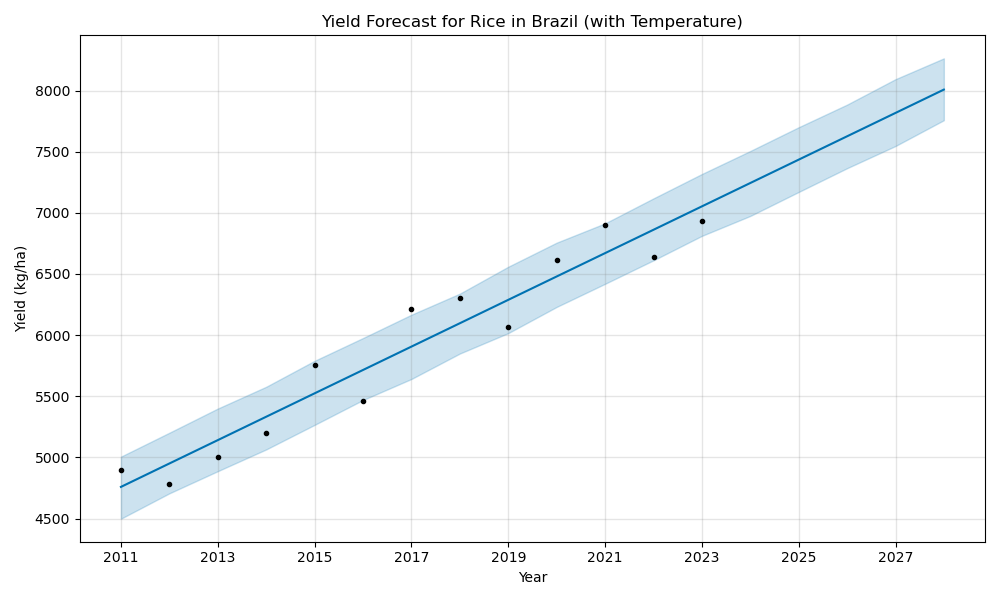
Brazil: Rice yield forecast (with temperature trends)
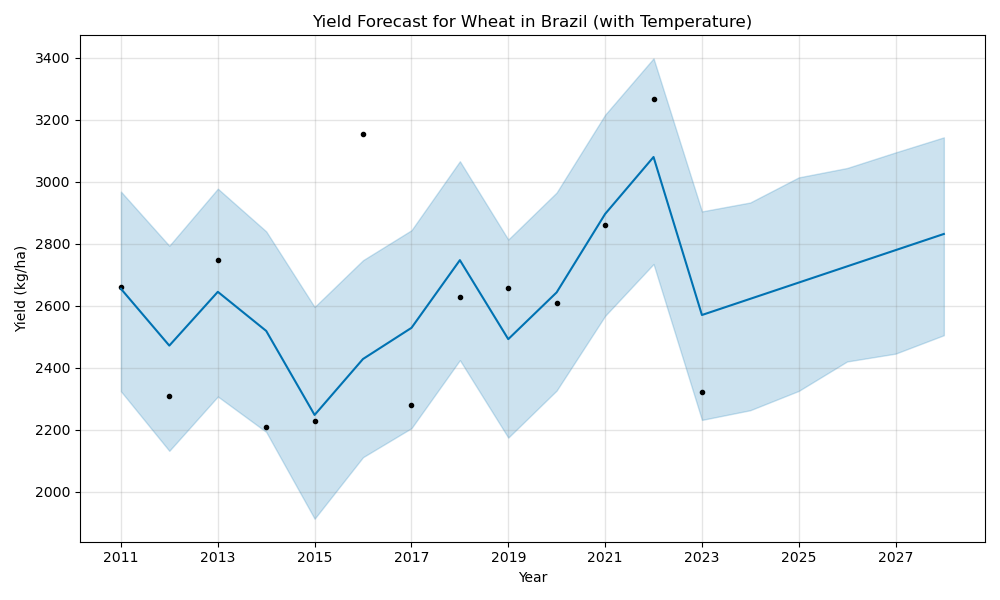
Brazil: Wheat yield forecast
_forecast.png)
Brazil: Maize (corn) yield forecast
_forecast.png)
Canada: Maize (corn) yield forecast
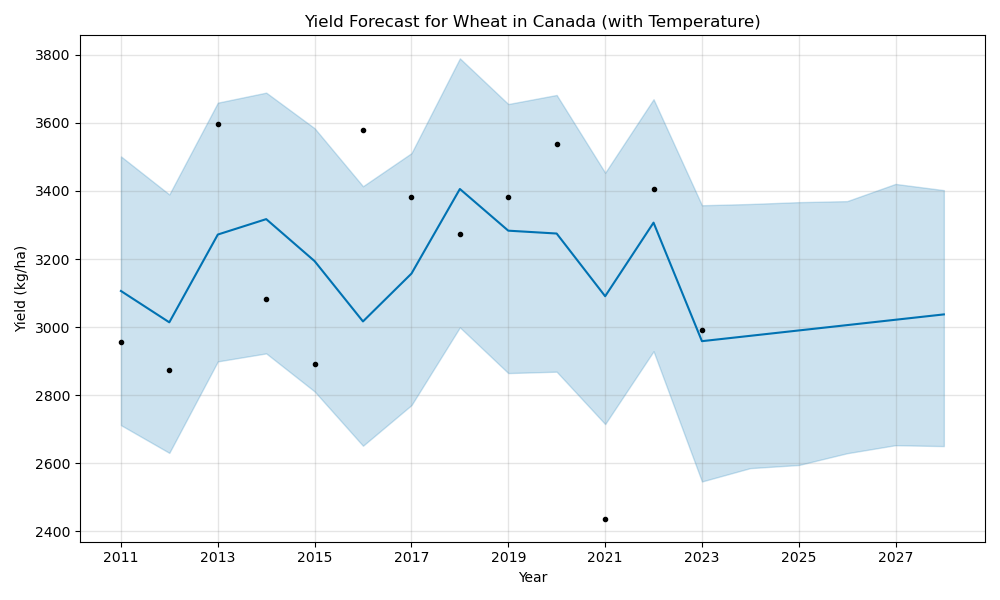
Canada: Wheat yield forecast
_forecast.png)
India: Maize (corn) yield forecast
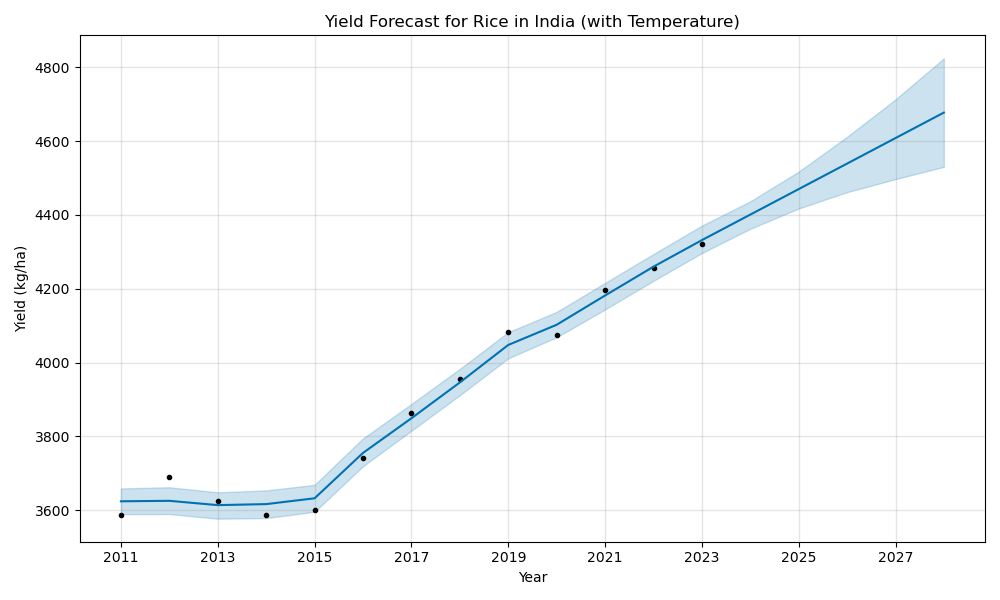
India: Rice yield forecast
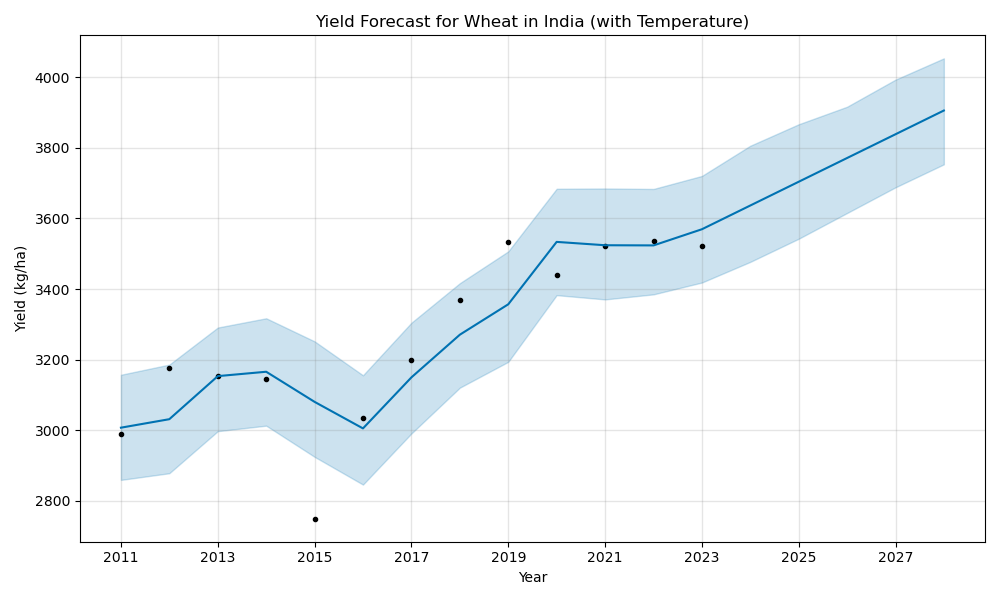
India: Wheat yield forecast
_forecast.png)
USA: Maize (corn) yield forecast
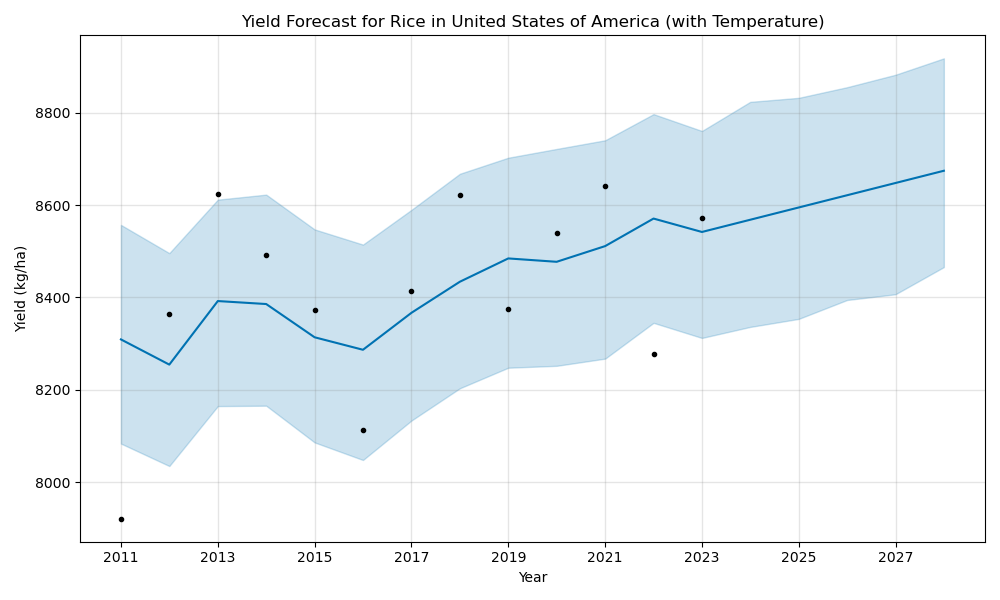
USA: Rice yield forecast
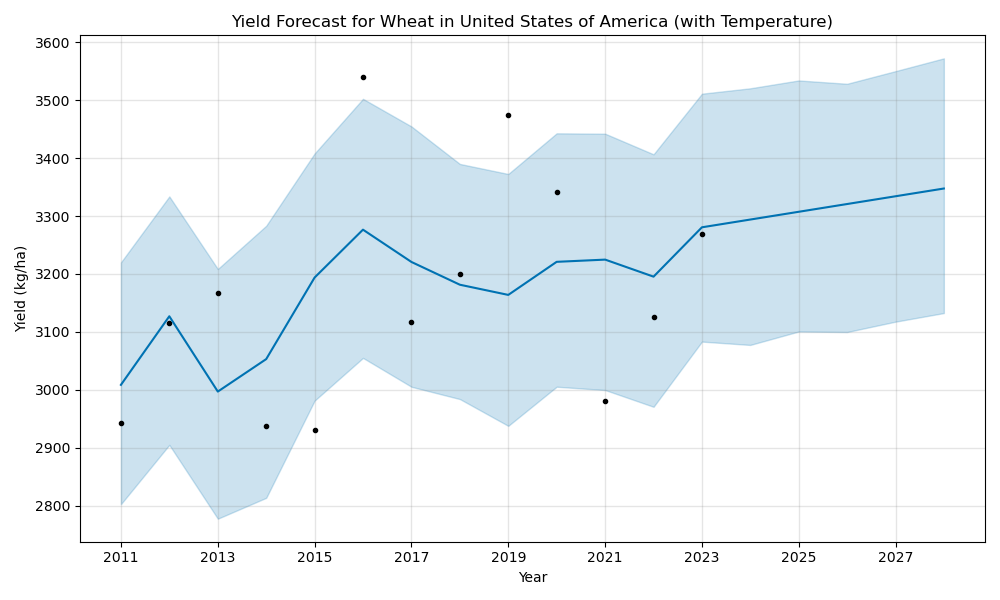
USA: Wheat yield forecast
Key Results & Learnings
- Discovered that some crops and geographical regions exhibit significantly higher sensitivity to temperature fluctuations than others, emphasizing the need for localized adaptation strategies.
- Learned the importance of explicitly quantifying and visualizing forecast uncertainty; this approach empowers decision-makers to assess risks and formulate more resilient plans.
- Developed a flexible and extensible forecasting pipeline that can be easily adapted to new countries, crops, or integrated with updated climate datasets.
Learnings & Reflections
For me, this project wasn’t just about building a model. It was about leveraging data science to make a tangible impact—providing actionable knowledge to help communities adapt and protect our global food supply. It reinforced my belief that rigorous data analysis, combined with clear communication of insights, can drive meaningful change beyond mere predictions.
Full Tech Stack Used
- Languages: Python
- Libraries: Pandas, Prophet, Matplotlib, Seaborn, Scikit-learn, SciPy
- Tools: Jupyter Notebook, Google Colab
- Concepts: Time Series Analysis, Feature Engineering, Data Cleaning, Data Visualization